7.1. Monitor Tab
7.1.1. Monitor Alerts
‘Monitor Alerts’ column helps you search and filter the monitor alerts. The alerts are by default categorized in three subjects:
Departments: The department category shows the names of all the departments under it. Here you’ll see the name of your departments only. Click on the department to see all the monitors assigned to that department. Such category is useful when you belong to multiple departments (or you are the admin) and want to see all the monitors of a specific departments.
RPE: The RPE category shows the names of all the RPEs available in the system. Click on the name of RPE to see all the monitors polled using it. Such category is useful when your network is distributed and you want to see all the monitors polled by a specific RPE.
Tags: The tags category shows you the names of all the tags available in the system. Click on the name of the tag to see all the monitors present under it. Such category is useful if you have assigned meaningful tags to the monitors (for example: type, status, vulnerability etc.). You can find very specific monitors using the tags.
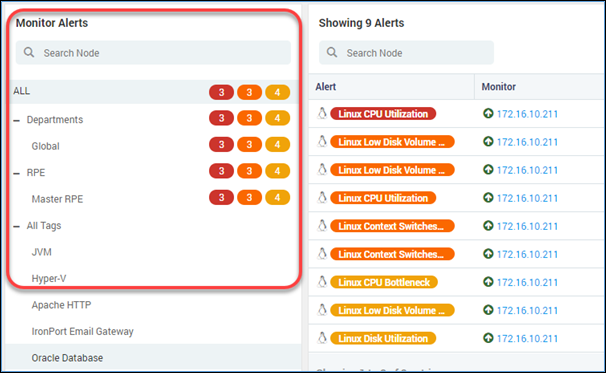
Monitor Alerts Column in Alerts
7.1.2. Alert List
The list shows all the alerts of the monitors from the last poll. The section shows the brief and important details of the alerts. Click on the alert name to see the complete details of the alert. The columns descriptions are as follows:
Column |
Description |
Alert |
Displays the name of the alert. |
Monitor |
Shows the host name/IP address of the monitor being monitored. |
Counter |
Shows the name of the metric on which alert is generated. |
Last Triggered |
Shows the last time when the alert was triggered. |
Duration |
Shows the duration for which the system is in current status of alert. When the status changes, the duration value resets. |
User |
When a user claims the alert, the username is displayed in the column. |
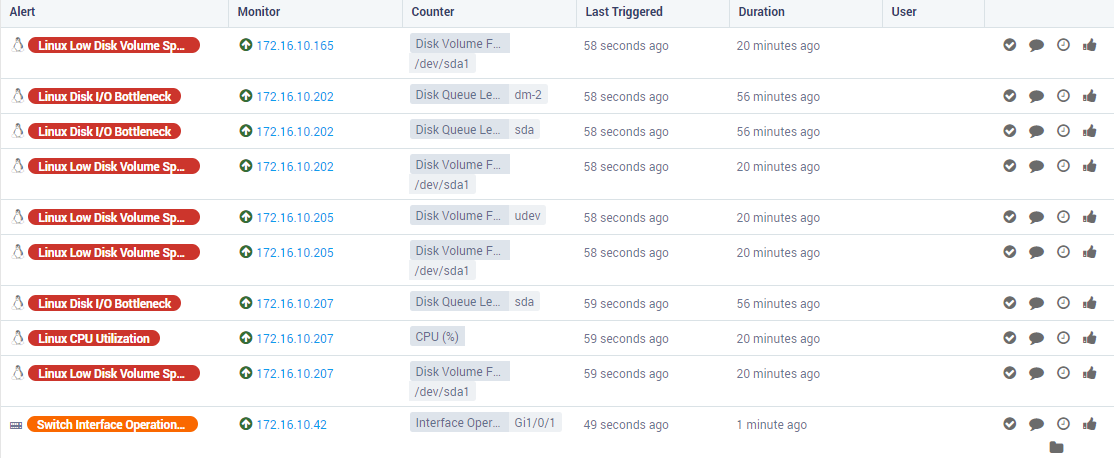
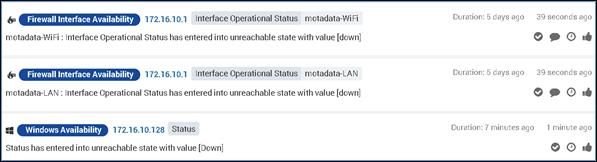
Alert List on Alert Steam Page
By default Motadata shows alert stream in Grid view. You can change the view to List view. This only changes how you see the alerts on the screen. There is no difference in options/menu or functionality aspects.
7.1.3. Alert Options
Alert options are the actions that you can perform towards the alert.
Clear Alert: Click on the icon to clear the alert. Clearing the alert means that the alert will not show until next poll. System will show you a popup to write a description (optional). System will also post a comment about details of the activity.
Post Comment: Click on the icon to add comments about the alert. The comment will be visible for all the alerts generated for that monitor. For example, if an alert of ‘Firewall Availability’ is generated from on 172.16.10.1 and user posts a comment: “Firewall Availability Alert”, on that particular alert then this comment will be visible on all the other alerts that are generated for the 172.16.10.1.
Suppress Alert: Click on the to suppress the alert. System will show you an option to define date and time. System will suppress the alert till that defined date-time. When an alert is suppressed, the system will automatically post a comment in the monitor about it. This helps the user to find who and when suppressed the alerts for the monitor.
Claim Alert: Click on the to claim an alert. One alert can be claimed only by one user. System will show the username of the person who is claiming the alert in ‘user’ column. System will post a comment about the activity.
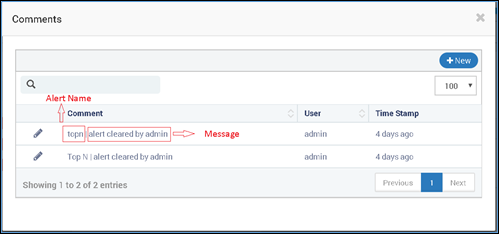
General View of Comments for the Alert
Note
Only for the Monitor Tab: The comments will show the name of the alert in the comment message. In the Flow, Log and Trap alerts, you’ll not see the alert name in the comments.
View Ticket: When a ticket is generated for the alert, you’ll see an eye icon. Click on the icon to see the ticket generated for the alert. A ticket is generated when ‘Trouble Ticket’ action is configured in system and assigned to the alert.
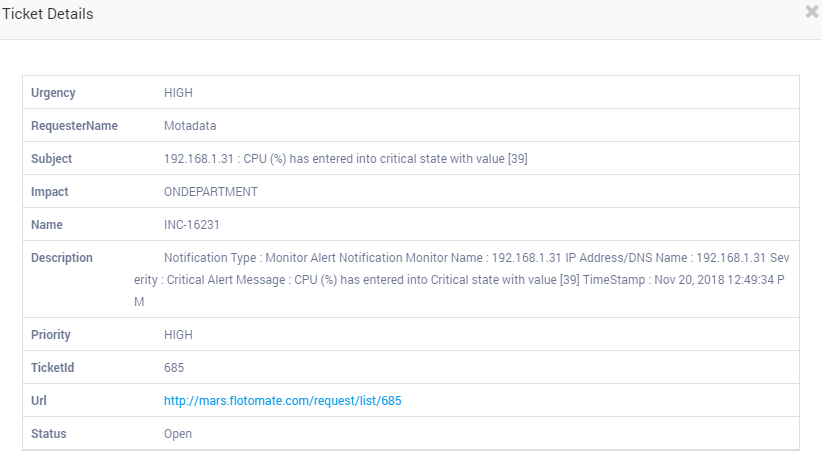
View Ticket
Alert Correlation: Alert Correlation is based on the topology. It reflects for the devices that are a part of the topology (read more about topology here). The correlation works on the device level and the link (interface) level. When an alert is generated for the topology (the node or a link goes down in topology), you’ll see a icon. Click on the icon to see the details of the alert.
On the device level, Motadata checks the availability of the device. When a device is down, the alert shows the unreachable device, directly connected interfaces and devices that are affected due to it.
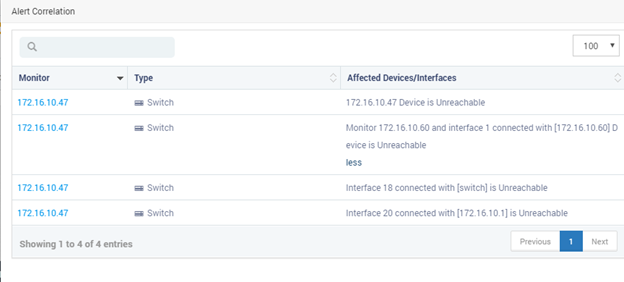
Alert Correlation when Device is Down.
On the interface level, Motadata checks the reachability of the device. When an interface is down, the alert shows the connected interfaces and devices affected due to it.
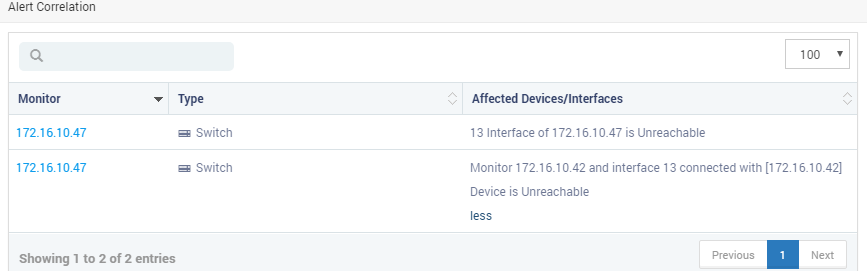
Alert Correlation when Interface is Down
7.1.4. Types of Alert Stream Views
You can view the alerts in Grid view and the List view. The grid view is the default view. You can change to the list view temporarily.
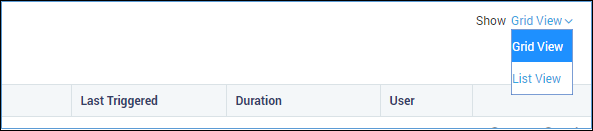
View Options
Grid View
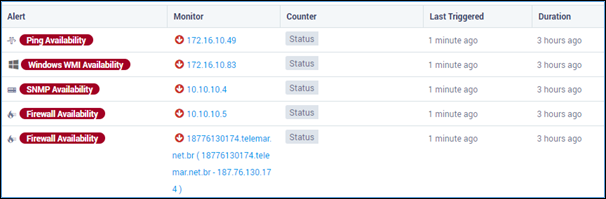
Grid View
List View
List View
Acknowledge/Unacknowledged Alerts: You can acknowledge an alert and move it from the default list. By default the list shows unacknowledged alerts. When you click on the ‘Acknowledge Alert’ button, the alert moves moves to ‘acknowledged alerts’ list. To unacknowledge an alert, go to ‘acknowledged alerts’ list and click on unacknowledge alert button.
7.1.5. Filters
By default the system do not show monitors in clear state. Use the filter option to see the alerts based on the filter conditions. The alerts can be filtered by:
Filter by Monitors: Select the monitors from the drop down. System will show alert streams only for selected monitors.
Filter by Severity: Select the severity levels from the drop down. System will show alert streams for monitors for selected severity levels only.
Filter by Alerts: Select the name of the alert you want to see. System will show only selected alerts.

7.1.6. Sort and Order
With sorting and ordering, you can see the alerts in ascending and descending order. Motadata uses trigger time and duration to sort and order the alerts.
View By
Unacknowledged Alerts: Unacknowledged-alerts is the default view in the alert stream. The view shows all the new alerts that are generated in system. Also, it shows the alerts for which you click on the unacknowledge button.
Acknowledged Alerts: The view shows all the acknowledged alerts in the system.
All Alerts: The view shows all the alerts (both acknowledged and unacknowledged).
Sort By
Triggered Time Use the ‘Last Triggered’ column to sort the list.
Duration Time Use the ‘Duration’ column to sort the list.
Order By
Ascending Sort the list in ascending order.
Descending Sort the list in descending order.
Descending with Severity First sort by severity and then in descending order.
Ascending with Severity First sort by severity and then in ascending order.

Viewing Sorting and Ordering